 SetiMapView_Setup_v6.55.exe (710 KB)
SETI@home-MapView reads the log files, which can be created with different utilities, and creates a skymap which shows the positions of all processed WUs and the quality of the found signals. In addition to the log files created with my tools SETI@home-Log9x and BoincLogX, the log files created with SetiDriver, SetiHide, SetiLog, SetiQueue, SetiSpy, StarMap or other utilities are supported, too.
Additionally, you can select between many different views which are described below.
Since version 4.0 it is possible to use skymaps with higher resolutions. An overview about available maps can be found on the skymap page.
SetiMapView_Setup_v6.55.exe (710 KB)
When you first start SETI@home-MapView, you will automatically come into the setup where you can adjust some basic settings. You can edit these settings later by choosing Setup in the settings menu.
SETI@home I/BOINC:
Use settings of Log9x/BoincLogX: If you use SETI@home-Log9x or BoincLogX you can automatically use its directory settings by activating this option.
Seti directories: If the option Use settings of Log9x/BoincLogX is deactivated you can specify the directories where your seti clients are installed. After pushing "Add" you can choose the right directory and add it to the list.
Log directories: In the same way as the seti directories, you can select the directories where your log files are stored.
Settings:
Filter duplicate entries: If this option is activated, duplicate WU and result entries are automatically removed.
Symbols: Here you can choose the style and size of the symbols drawn in the skymap.
Wallpaper:
Here you can adjust the settings for creating the windows wallpaper. The settings for the wallpaper are almost the same as for the skymap in the program itself. The vertical stretch factor lets you control if the skymap should maintain aspect ratio (factor 1.0) or fills the whole screen (factor 1.5).
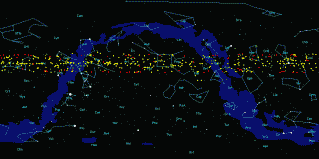
The skymap is the heart of SETI@home-MapView. The different settings are described below. You can save the created skymap with a right mouse click on the map.
Data:
Here you can choose between different views for the skymap itself. The WUs views will show a little dot for every WU. The color indicates the strength of the selected signal type (Peak, Gaussian, Pulse or Triplet).
Normally, a WU is not recorded at a single point in the sky as shown in the WUs view. In reality, the telescope moves during recording of a WU. To show the path of this movement, there is the WU Move view which draws a line between start and end of a WU. The color of this line will indicate the strength of the signal, again.
The following colors are used in the first two types of view:
Dark green: relatively weak signal
Yellow: middle strength of signal
Red: relatively strong signal
The Results view makes it possible to view the contents of the result log files, which can be created with SETI@home-Log9x and BoincLogX only. The following colors are used in this view:
Yellow: Spikes
Red: Gaussians
Orange: Pulses
Pink: Triplets
Options:
[Show topical WUs] If this option is enabled the topical WUs, which are in the clients at the moment, will be drawn as a light green circle.
[Highlight best WU] This option will highlight the WU with the strongest signal of the selected signal type. This WU will be marked with a red circle around the normal red dot.
[Highlight Arecibo region] The Arecibo telescope used by SETI@home only covers a part of the sky. With this option enabled, SETI@home-MapView will highlight the region scanned by the Arecibo telescope with a dark gray color.
[Show extrasolar planets] This option makes it possible to show the positions of known (and confirmed) extrasolar planets. The positions are marked with a blue circle and an attached label which shows the name / catalog Id of the surrounded star. Small blue dots at the line of the circle show the number of confirmed planets around this star. For additional information about extrasolar planets, please visit Jean Schneiders Extrasolar Planets Catalog.
[Show grid] With this option you can show or hide the coordinate grid in the map.
[Show All/Top 10/Top 25 etc] You can choose if you want to see all WUs or only the WUs with the strongest signals in the skymap.
Zoom:
With this function you can enlarge or scale down the skymap. If you choose Fit In the map will be automatically resized to fit into the program window.
Map:
If you have installed enhanced skymaps you can choose one of the maps here. Additional information about available maps can be found on the skymap page.
Example:
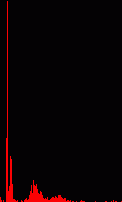
In this view you can see the distribution of results in the checked chirprates. Most signals will have a chirprate of 0 Hz/sec. That's why you can choose Cut "0 Hz/sec" to reduce the height of the 0 Hz/sec entry and make the graph more useable.
It's only possible to show this, if you have result log files which can be created with SETI@home-Log9x and BoincLogX only.
Example:
 |
||
| -50 Hz/sec | 0 Hz/sec | +50 Hz/sec |
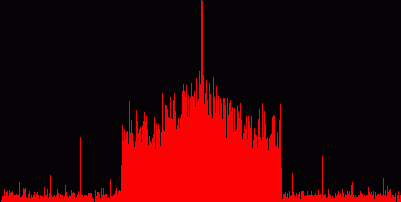
This view shows the distribution of WUs or Results in the frequency spectrum of SETI@home. Light green bars show the topical WUs which are in your clients at the moment.
It's only possible to show result data, if you have result log files which can be created with SETI@home-Log9x and BoincLogX only.
Example:
 |
||
| 1418.75 MHz | 1420 MHz | 1421.25 MHz |
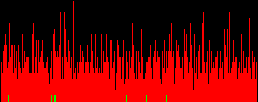
This view makes it possible to show the CPU times used to process your WUs.
Example:
 |
||
| 0h30 min | 30h45min | 61h00min |
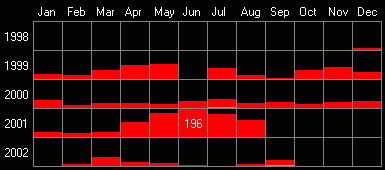
The calendar view provides different time based looks. The settings are explained below.
Data:
If you choose WUs (recorded) you will see a calendar with the dates, where your WUs have been recorded. Light green entries mark the topical WUs, which are in your clients at the moment. Results per WU will show you the average number of results for the dates. This type of view is only possible with result log files, which can be created with SETI@home-Log9x and BoincLogX only. Additionally, you can receive a calendar which shows when you have processed the WUs by selecting the WUs (processed) view.
Division:
Here you can select the division which is used for the calendar. You can choose between Daily, Weekly and Monthly.
Values:
With this option you can control the appearance of numerical values in the calendar. You can completely hide them (None), only show them on days with highest values (Only highest) or you can show them in each field of the calendar (All).
Example:
The commandline option -wallpaper let's SETI@home-MapView make a wallpaper out of the map. With SETI@home-Log9x and BoincLogX you can automatically generate a wallpaper when you choose make wallpaper in its setup.
If you want to test SETI@home-MapView, without having your own log files yet, you can download example log files (300KB). These log files include real data of 500 WUs and were created with SETI@home-Log9x. You only have to extract the example log files into a directory of your choice and add it to the list of log directories in the setup of SETI@home-MapView.
An overview about changes made since previous versions can be found here.
If you have any comments, suggestions or questions, please visit the forum. Don't forget to read the FAQ before sending bug reports or questions.
You can use SETI@home-MapView without charge but you do it at your own risk.